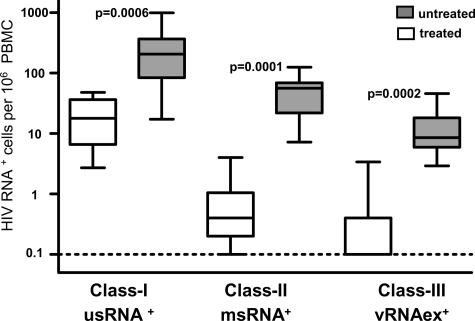
FIG. 1.
HIV-1 RNA+ cells in total PBMC. Frequencies of cells positive for usRNA (class I), msRNA (class II), and vRNAex (class III) were calculated by limiting dilution analysis. Open bars depict data from treated patients (group A) and shaded bars frequencies in untreated patients (group B). P values indicate comparison of group A to B (Mann-Whitney test). “Box and whisker” bars depict medians, quartiles, and ranges. The broken line indicates the lowest detection threshold for PBMC expressing HIV-1 RNA.

