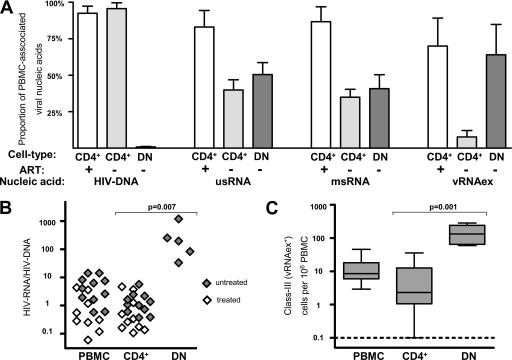
FIG. 2.
High levels of HIV-1 production in CD4−/CD8− T cells from untreated patients. (A) Proportions of HIV-1 nucleic acids in PBMC attributed to CD4+ T cells (CD4+; gray bars, untreated patients; open bars, on-treatment patients) and CD4−/CD8− T cells (DN [double negative]; dark bars, untreated patients; no analysis during ART was possible due to almost-complete depletion of viral DNA and RNA). Error bars show standard errors of the means. +, on-treatment patients; −, untreated patients. (B) HIV RNA expression normalized to HIV DNA content in PBMC, CD4+ T cells (CD4+), and CD4−/CD8− T cells (DN) in untreated and treated patients. HIV RNA expression was calculated as the sum of the average msRNA and usRNA expression at each time point. (C) Frequencies of cells positive for vRNAex (category III) in PBMC, CD4+ T cells (CD4+), and CD4−/CD8− T cells (DN) of untreated patients. The broken line indicates the lowest detection threshold for cells expressing HIV-1 RNA. “Box and whisker” bars depict medians, quartiles, and ranges. Analyses A to C comprised one data point per visit, resulting in duplicate measurements for PBMC and CD4+ T cells for all patients except for patients 03, 08, and 11. (B and C) Results of nonparametric comparison of CD4+ versus CD4−/CD8− T cells using Mann-Whitney testing are indicated by P values.

