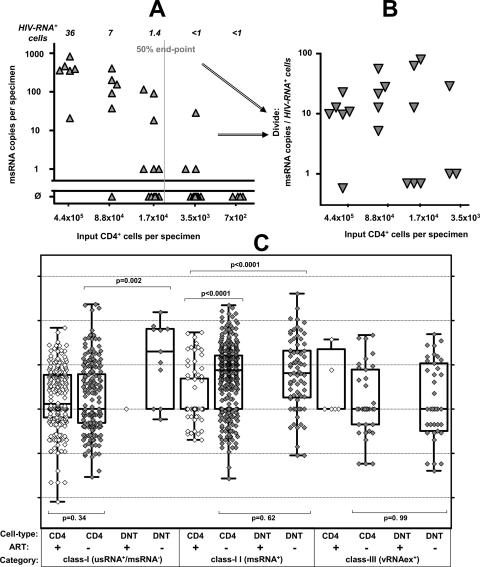
FIG. 4.
Specific HIV contents per cell of CD4+ and CD4−/CD8− T cells. (A and B) Schematic outline of determination of specific cell contents as exercised by measurements of msRNA (class II expression) in CD4+ T cells obtained from patient 10. (A) Primary measurements of msRNA levels in serial five-fold dilutions of purified CD4+ T cells are shown in panel A. Triangles depict individual measurements and the vertical gray line shows the calculated 50% end point of specimens positive for msRNA. Italic numbers above the panel show the calculated numbers of HIV RNA+ cells in each dilution series. (B) Normalization of measured HIV msRNA copies to numbers of HIV RNA+ cells results in specific HIV RNA contents in each sample with detectable msRNA (triangles). (C) Per-cell HIV RNA expression data comprising per-cell expression in resting, activated, and total CD4+ T cells (CD4+) and CD4−/CD8− T cells (DNT [double negative]) from all patients and time points is displayed by single data points (open symbols, on-treatment patients; gray symbols, untreated patients) and “box and whisker” bars showing medians, quartiles, and ranges. Note that viral RNA expression in CD4−/CD8− T cells obtained from patients on ART, remaining below the threshold of detection, could not be displayed except for one sample (left panel, class I expression). Results of nonparametric comparisons using Mann-Whitney testing are indicated by P values.

