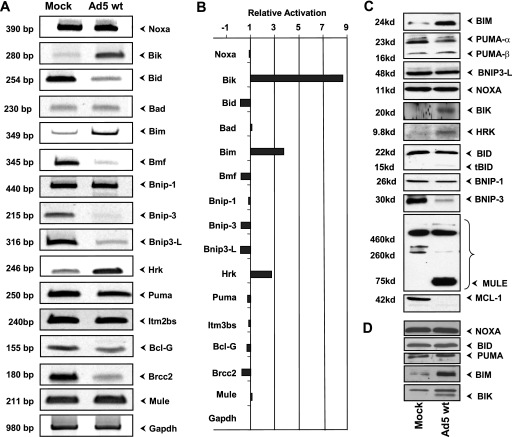
FIG. 4.
Effect of Ad infection on the expression of BH3-only family members. (A) RT-PCR analysis of various BH3-only members in A549 cells. The analysis was carried out using multiple dilutions of the first strand of the cDNAs, and representative images of the cDNA fragments were stained with Vistra Green. (B) Quantification of RT-PCR analysis. The relative intensities of the bands in panel A were quantified by using ImageQuant software. (C) Western blots of BH3-only proteins in mock-infected and wt Ad5-infected A549 cells. The effect on MCL-1 (BH1234) is shown in the bottom blot. (D) Western blots of BH3-only proteins in mock-infected and wt Ad5-infected HNK cells.

