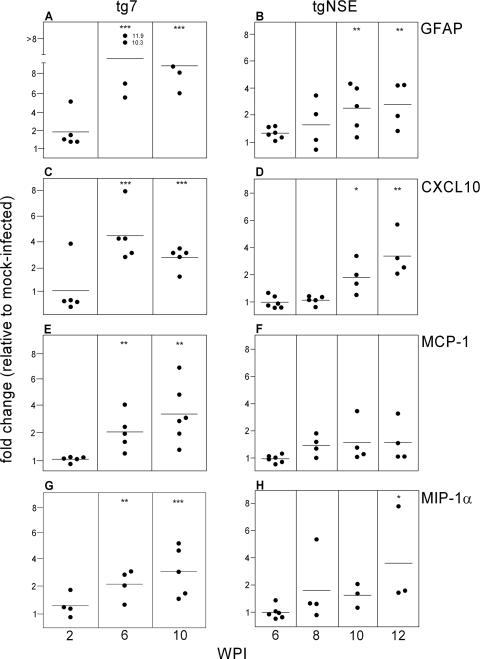
FIG. 5.
Real-time RT-PCR of tg7 and tgNSE eye RNAs for chemokine expression. The graphs show changes for individual eyes at 2, 6, and 10 weeks p.i. (tg7) and 6, 8, 10, and 12 weeks p.i. (tgNSE). The RNA was examined for GFAP (A and B), CXCL10 (C and D), MCP-1 (E and F), and MIP-1α (G and H). For each time point, four to six infected animals and three or four mock-infected animals were tested. The horizontal lines indicate the mean change, and the asterisks indicate statistically significant changes versus mock-infected controls (Mann-Whitney test; *, <0.05; **, <0.005; ***, <0.0005).

