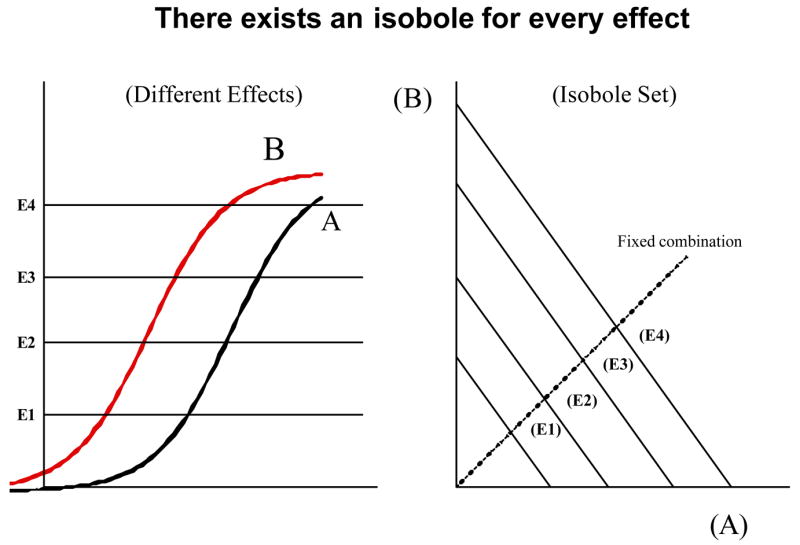
Fig.3.

When the two drugs have a constant potency ratio their log(dose)-effect curves are parallel indicating a constant relative potency at every effect level and shown here(left) for four effect levels. For every effect level there is an isobole of additivity and these are linear and parallel (right).
