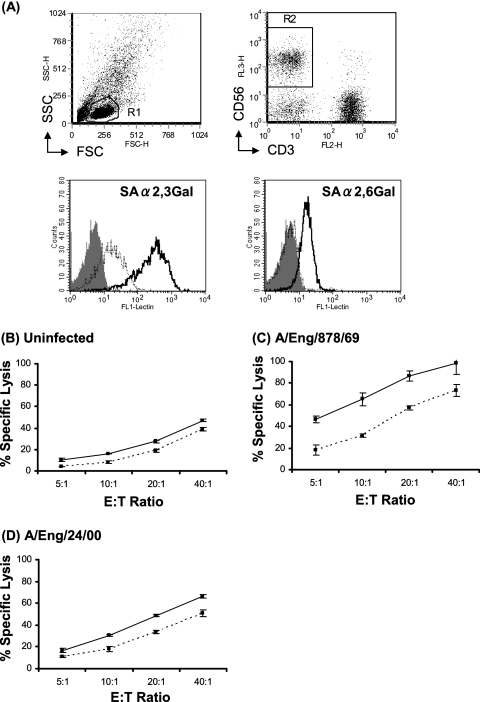
FIG. 4.
NA treatment of NK cells reduces lysis of influenza virus-infected target cells. PBMCs were treated with NAs or were left untreated. The cells then were stained with DIG-labeled MAA or SNA followed by a fluorescein isothiocyanate-conjugated anti-DIG antibody to determine the expression of SA-α-2,3-Gal or SA-α-2,6-Gal, respectively. NK cells were identified by costaining with antibodies against CD3 and CD56. (A) The upper left panel shows the forward scatter (FSC) versus side scatter (SSC) profile of total PBMCs and the R1 gate set to identify the lymphocyte population. The upper right panel shows CD3 versus CD56 staining of the R1 population and the R2 gate set to identify the CD3− CD56+ NK cell population. In the lower two panels, the gray-shaded histograms represent staining of gated NK cells without lectins, the solid lines represent NK cells without NA treatment, and the dotted lines represent NK cells with NA treatment. The results shown are representative of findings from three independent experiments using PBMCs from different donors. 51Cr release assays also were performed to investigate the percentage of specific lysis of uninfected 143BTK− cells (B), 143BTK− cells infected with A/England/878/69 (C), or 143BTK− cells infected with A/England/24/00 (D) by control and NA-treated PBMCs at a range of E:T ratios. In each graph, the solid line represents the lysis mediated by control PBMCs, and the dotted line represents the lysis mediated by PBMCs treated with NAs. The data are means of triplicate values, and the results shown are representative of findings from three different experiments.

