
FIGURE 4. Body weight and weight gain in response to high fat/high cholesterol diet in mice.
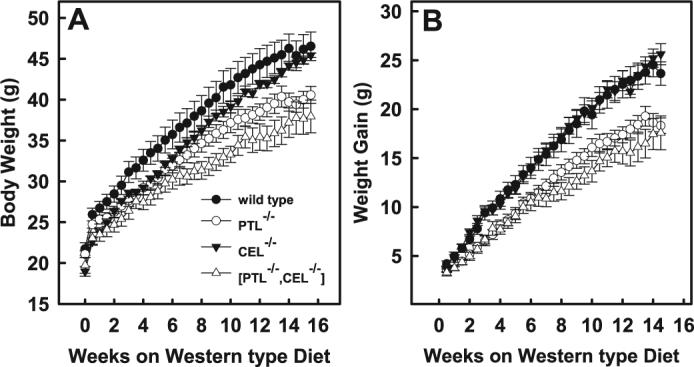
Male mice consuming a chow diet were transferred to a high fat/high cholesterol diet at 9 weeks of age. Body weight was monitored twice per week. Total body weight (A) as well as the rate of body weight gain (B) is plotted as the means ± S.E. from n = 10 wild type (•), 10 PTL−/− (○), 9CEL−/− (▼), and 9 PTL−/−,CEL−/− (▽) mice. The body weight of PTL−/− mice was statistically different from wild type counterparts at 3−4.5, 9.5, and 10.5−13.5 weeks at p < 0.05 and 14−15.5 weeks at p < 0.01. The body weight of CEL−/− mice was statistically different from wild type counterparts at 0, 1.5, 2, and 4 weeks at p < 0.05 and 0.5−1 week at p < 0.01. The body weight of PTL−/−,CEL−/− mice was statistically different from wild type counterparts at 0.5−3.5, 5−6.5, and 14.5 weeks at p < 0.05 and 4, 4.5, 7−14, and 15−15.5 weeks at p < 0.01. The body weight gain of PTL−/− mice was statistically different from wild type counterparts at 1.5−2.5, 4, 5−9.5, 10.5, and 13.5 weeks at p < 0.05 and 3, 3.5, 4.5, 11−13, and 14−14.5 weeks at p < 0.01. The body weight gain of PTL−/−,CEL−/− mice was statistically different from wild type counterparts at 1−2, 5−6.5, 10, and 14.5 weeks at p < 0.05 and 2.5−3, 4, 4.5, 7−9.5, and 10.5−14 weeks at p < 0.01. The body weight gain of CEL−/− mice was not different from wild type controls for the duration of this study.