
FIGURE 5. Assessment of body composition by NMR.
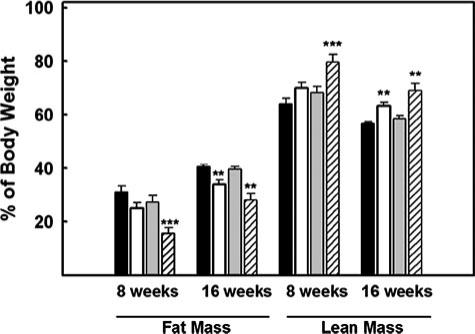
Quantitative nuclear magnetic resonance was used to measure fat and lean body mass of live mice that had been consuming chow or a Western-type diet. The method was applied to mice that were 16 and 25 weeks old and consuming the Western-type diet beginning at 9 weeks of age. Data shown are the means ± S.E. from n = 10 wild type (black bars), 10 PTL−/− (white bars), 9 CEL−/− (gray bars), and 9 PTL−/−,CEL−/− mice (hatched bars). **, p < 0.01; ***, p < 0.001 (differences from wild type mice analyzed at the same time point and consuming the same diet).