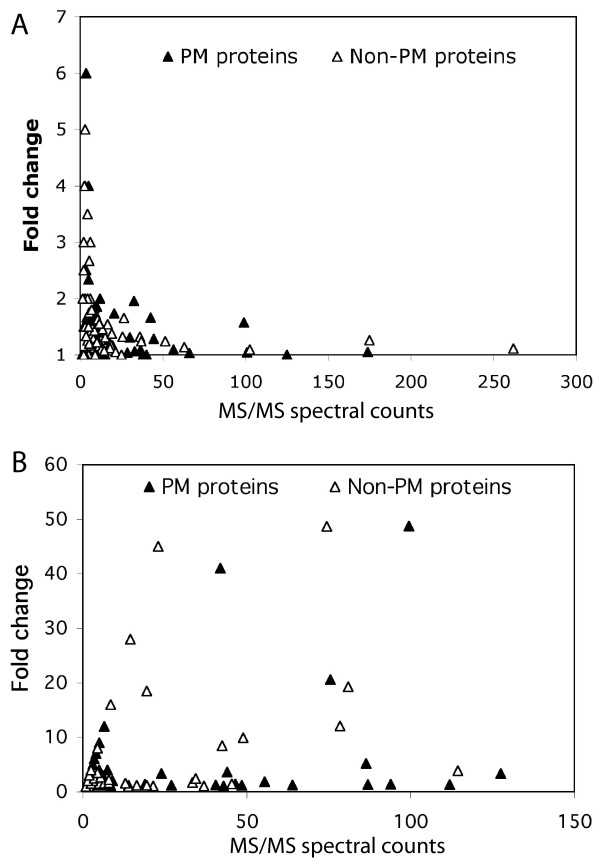
Figure 4.
Variations of quantification by spectral counting. The variations in spectral counts for each protein were compared between the TubeGeLC/MS/MS and the GeLC/MS/MS protocols. The ratio of the spectral count per protein between two samples is presented as fold-change and plotted against the average of the spectral count of two samples. Panel A shows the results from the TubeGeLC/MS/MS method and panel B from the GeLC/MS/MS protocol.

