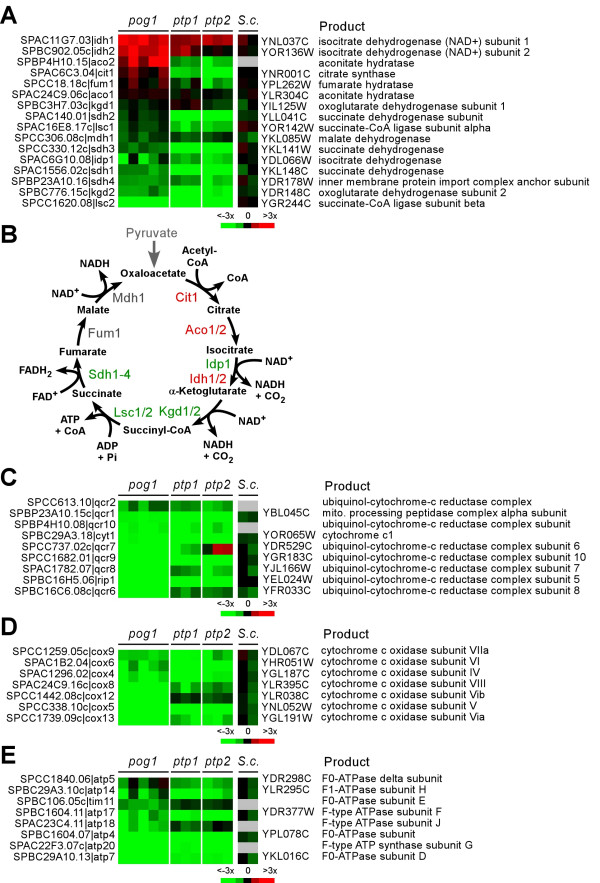
Figure 5.
Expression profiles of pog1Δ, ptp1-1, and ptp2-1 cells. (A) Expression profiles of genes encoding TCA cycle enzymes. The phasogram of gene expression profiles (mtDNA-less cells versus wild type cells) is shown in which rows indicate genes and columns indicate individual repeats (for S.c., columns represent different cell densities). S. pombe gene names are listed in the left and S. cerevisiae (S.c.) are listed in the right. Induced expression levels are shown in red and repressed are in green (S.c. data are based on the study by Epstein et al.). No changes are in black and no data are in grey. The color key is shown at the bottom. (B) TCA cycle. Genes induced are indicated in red while genes repressed are in green. (C-E) Expression profiles of genes encoding proteins involved in cytochrome c reductase, oxidase, and ATP synthase complexes, respectively. The profiles are displayed as in (A).

