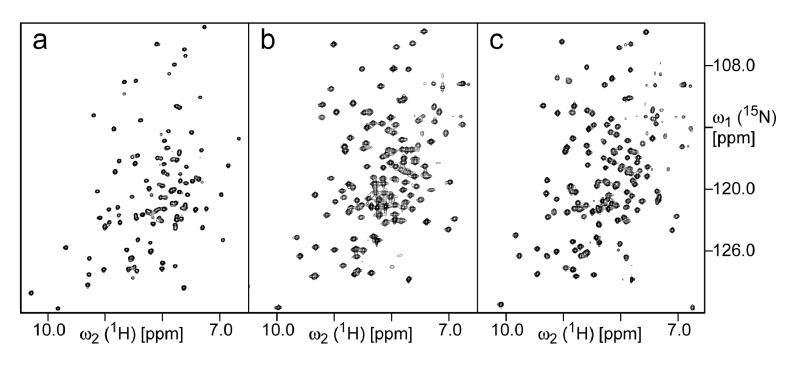
Figure 5.
2D [15N,1H]-TROSY spectra of (a) L11; (b) L11-RNA complex; and (c) L11-RNA-thiostrepton complex. The concentration of 15N,2H-labeled L11 in all samples was 0.7 mM. For both complexes, non-labeled RNA was used. For the L11-RNA-thiostrepton, non-labeled thiostrepton was used. All spectra were recorded at pH 6.5 and 40 °C on a Bruker Avance600 spectrometer. In order to achieve the maximum sensitivity, all three spectra were recorded using different delays for polarization transfer, as well as different t1max and t2max.

