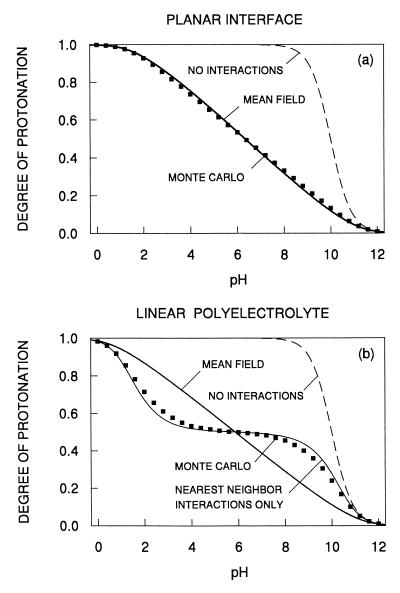
Figure 3.
Titration curves derived from discrete-charge Ising models. Comparison of Monte Carlo simulations (symbols) with the mean-field approximation (solid line, Eq. 5). Parameters are the same as in Fig. 2. The sites have pK = 10 and are uncharged in the deprotonated state. (a) Ionizable sites are arranged within a planar interface on a square lattice with lattice spacing of 1.1 nm, and (b) along the axis arranged along the axis of the cylinder with a spacing of 0.35 nm. The broken line represents the result without interactions. In b, the thin line is the analytical solution of the Ising model on a linear chain with nearest-neighbor pair interactions.

