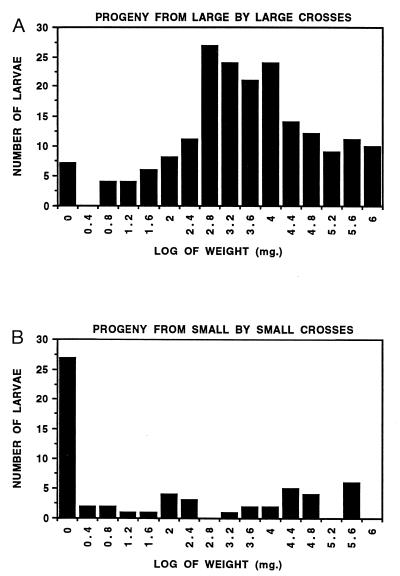
Figure 2.
Histograms depicting the frequency of F2 larvae in given size classes (natural log) after rearing on 0.064 μg/ml CryIA(c). (A) F2 larvae resulting from all single pair crosses of F1 larvae that had grown well on Bt-containing diet. (B) F2 larvae resulting from all single pair crosses of F1 larvae that had grown poorly on Bt-containing diet.

