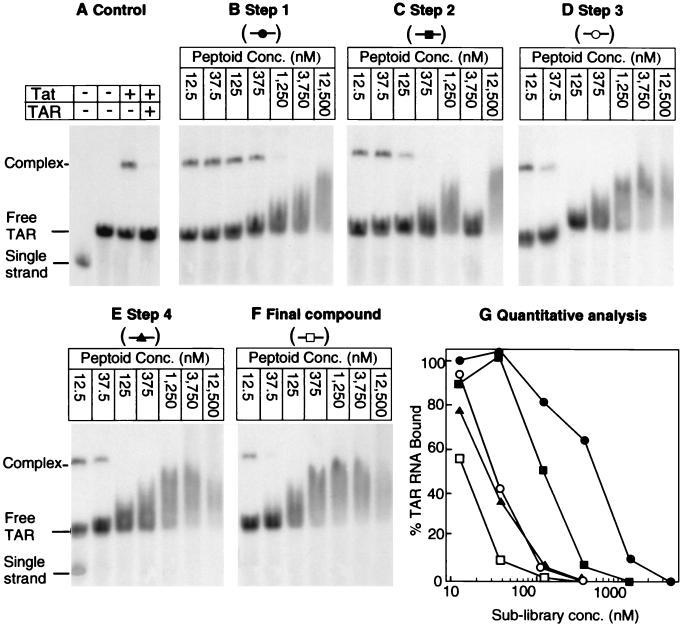
Figure 2.
Analysis of sublibraries by gel mobility-shift assay. (A) Control gel mobility-shift assays. First two lanes show the migration of 32P-labeled 14-mer oligonucleotide and 32P-labeled TAR RNA duplex. Second two lanes show Tat binding reaction mixtures containing 500 fmol of 32P-labeled TAR RNA duplex and 20 nM recombinant Tat protein. The last lane contained 20 nM unlabeled TAR RNA competitor. (B–F) Competition binding assays. Binding reaction mixtures contained 500 fmol of 32P-labeled TAR RNA duplex, 20 nM recombinant Tat protein, and between 12.5 nM and 12.5 μM each sublibrary. (G) Quantitative analysis of the binding data obtained by PhosphorImager analysis of gel shown in B–F.

