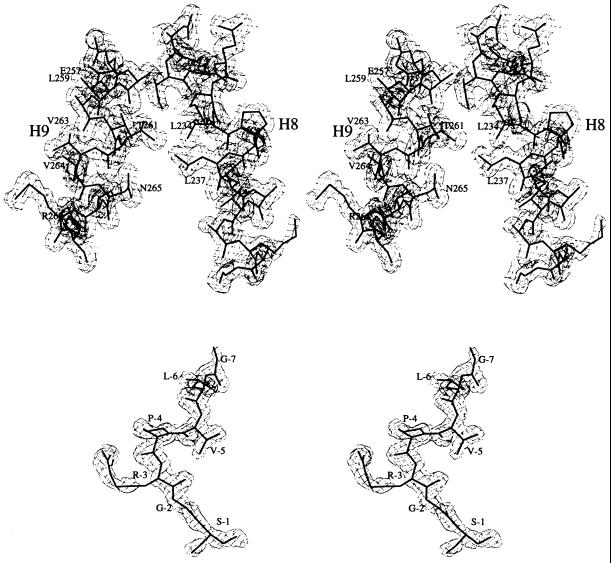
Figure 1.
2Fo-Fc electron density map calculated with SIGMAA coefficients (23), contoured at 1σ (σ is the root-mean-square deviation from the mean electron density in the unit cell). Superimposed is the refined atomic model. (Upper) Helices H8 and H9. (Lower) The N-terminal tag. Drawn with the bobscript (extensions to the program molscript; ref. 24).

