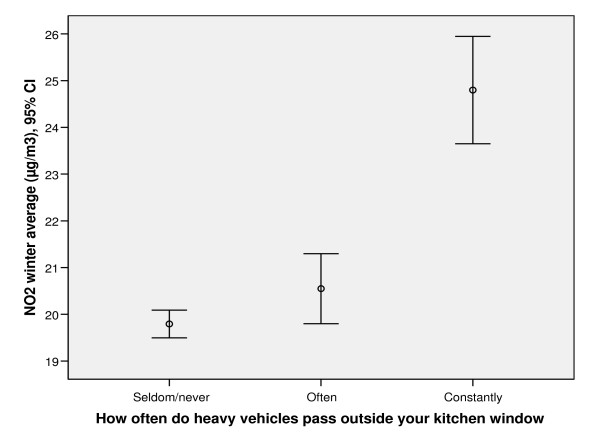
Figure 3.
The mean levels of modelled NO2 in relation to frequency of heavy traffic outside home. Error bars showing the mean level of modelled NO2 outside the home within subjects reporting the frequency of heavy traffic outside the kitchen window as seldom/never, often or constantly, respectively.

