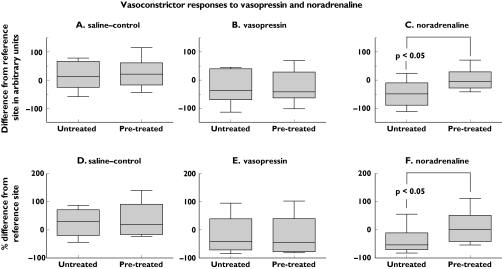
Figure 2.
Vascular responses to vasopressin, noradrenaline and saline-control iontophoreses at pretreated and untreated sites in the forearm. Responses after the second set of iontophoreses are shown and are expressed in relation to blood flow at a reference site in the forearm. Decreases in blood flow after the noradrenaline iontophoreses were greater in untreated than pretreated skin (P< 0.05)

