
Figure 5.
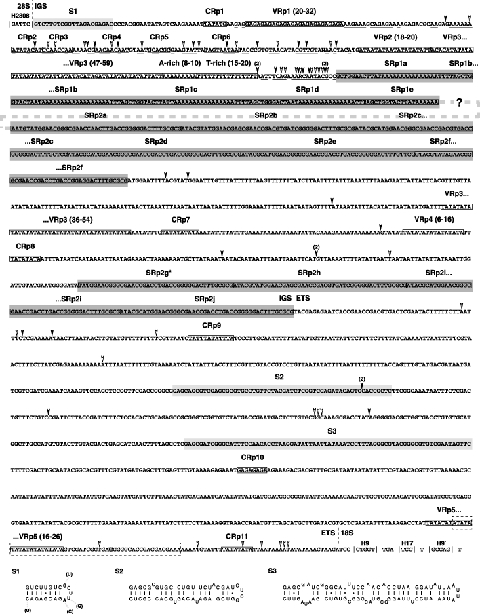
Regions of the IGS and ETS flanking the 3′-half of the 28S rDNA and the 5′-half of the 18S rDNA in the honey bee. Diagram depicts a consensus of assembled contigs, with infrequent insertions (filled arrows) and deletions (open arrows) shown in conserved regions of the alignment, as well as in conserved repetitive (CRp) regions. Length variation within variable repetitive (VRp) regions is given as ranges. Variation in sequence length and base composition is not provided for sub-repetitive (SRp) regions. All repetitive regions, as well as single-base length variable regions, are boxed and contiguous (SRp) regions are darkly shaded. The region of the IGS for which sequence identity was not possible due to intragenomic heterogeniety is depicted with a dashed line linking two large (SRp) regions. A putative promoter sequence, as predicted with the Neural Network Promoter Prediction tool (Reese, 2001) at the Berkeley Drosophila Genome project (http://www.fruitfly.org/seq_tools/promoter.html) is within a dashed box, with the bolded nucleotide depicting the predicted transcription start site. Conserved rRNA helices flanking the IGS (H2808) and ETS (H9) are within vertical bars (|). Regions with putative secondary structures (S1–S3) are lightly shaded, with structural diagrams shown below the alignment. The structure for S1 is shown with variable bases in a related hymenopteran, Myrmecia croslandi, shown in parentheses. Alignments are available at the jRNA website.