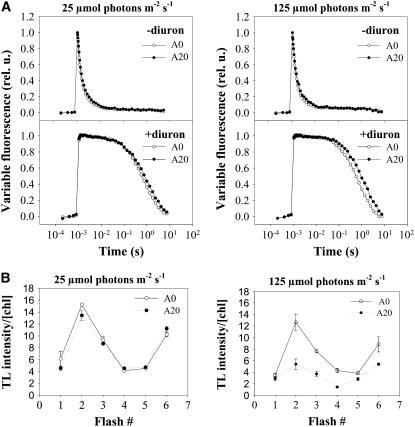
Figure 4.
Relaxation of the Variable Fluorescence and Oscillations of the Flash-Induced Thermoluminescence B Band in Cells of Strains A0 and A20 Cultivated at 25 and 125 μmol·m−2·s−1 White Light.
(A) Cells of A0 (open circles) and A20 (closed circles) at 2.5 μg chlorophyll/mL were dark-adapted for 5 min, and the decay in variable fluorescence was followed before and after a saturating flash using the PSI double modulated fluorimeter in the absence (left panel) or presence (right panel) of the PSII inhibitor diuron (10 μM final concentration).
(B) Cells of A0 (open circles) and A20 (closed circles) at 25 μg chlorophyll/mL were filtered onto the nitrocellulose membrane and dark-adapted for 5 min, one to six flashes were applied at 3°C, and thermoluminescence in the range 3 to 70°C was measured using the PSI thermoluminometer. The area below the TL glow curve was plotted against the number of flashes. Values are means of three measurements ± sd.

