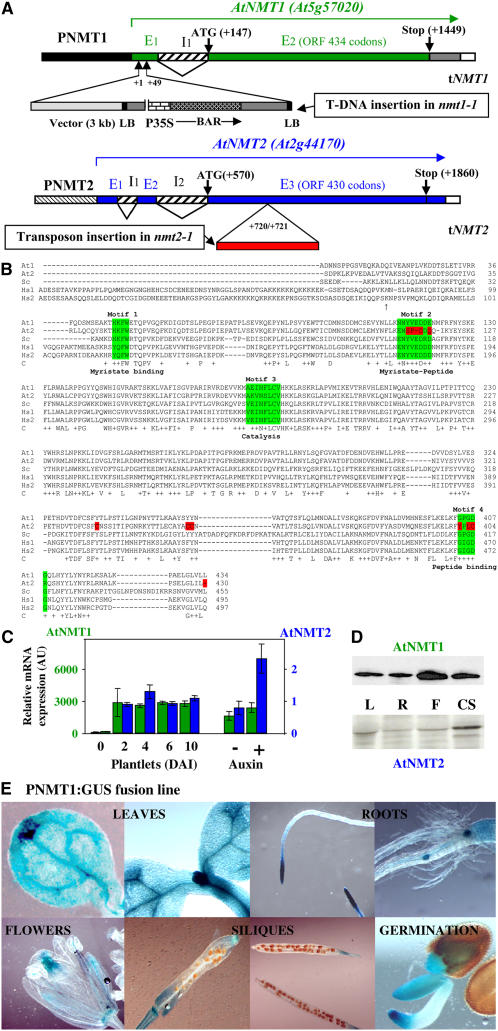
Figure 1.
ORFs, Genes, and Expression Patterns of NMT1 and NMT2 in Various Organs and during Development.
(A) Schematic representation of the wild-type At NMT gene structures and their disruption in Arabidopsis lines nmt1-1 and nmt2-1. The exon (En)–intron (In) structure of the gene is shown. Translation initiation (ATG) and termination codons (stop) are indicated. At NMT1: The tandem T-DNA insertion in the nmt1-1 line is shown, with the border sequences of the insert (left border [LB] and cloning vector) labeled to indicate the orientation of the insertion. BAR encodes the BASTA resistance gene. P35S is the 35S promoter. The exact location of the T-DNA insertion (+1/+49 from the origin of the transcript, as indicated in GenBank under accession number AF250956) was checked by DNA sequencing, PCR amplification, and restriction fragment length analysis. At NMT2: The location of the inserted transposon in line nmt2-1 is indicated from the origin of the transcript (as indicated in GenBank under accession number AF250957). The location of the inserted transposon end was checked by DNA sequencing, PCR amplification, and restriction fragment length analysis.
(B) The full-length ORFs of each NMT used in this study were aligned using ClustalX (Jeanmougin et al., 1998). The numbering of each of the five amino acid sequences is indicated below the sequences for each block of 100 residues. Amino acids shown with an arrow at the N terminus of Hs NMT1 indicate the alternative translation start sites of each isoform. Line C shows strictly conserved residues within the catalytic core are shown below the amino acid sequence. Conservative changes are indicated with a plus sign. In the last line, the region highlighted in green corresponds to the binding sites of each substrate (Motifs 1 to 4). Residues shown in red are not conserved in At NMT2. At, Arabidopsis NMTs (At1 and At2); Sc, S. cerevisiae NMT; Hs, H. sapiens NMTs (Hs1 and Hs2).
(C) Levels of transcripts for cytoplasmic NMTs expressed relative to actin transcript levels. Measurements were made by real-time PCR. Left: NMT1 or NMT2 levels in wild-type seedlings DAI 6 were taken as 1. The synthetic auxin variant used was 2,4-D (see Results). AU, arbitrary units.
(D) Relative levels of At NMT1 and At NMT2 proteins. Left: Immunoblot analysis performed in leaves (L), roots (R), flowers (F), and cell suspensions (CS) with specific antibodies against each of these NMTs.
(E) Expression of PNMT1:GUS in seedlings. Various NMT1 promoter-GUS (PNMT1:GUS) lines were analyzed. A representative image is shown in each case.

