Figure 4.
Further Developmental Defects Are Revealed with an NMT1 Ethanol-Inducible Line.
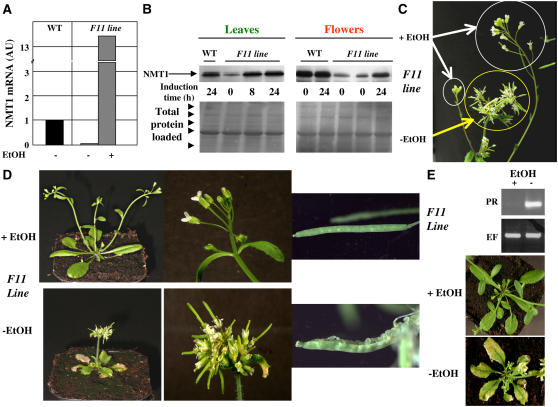
(A) Real-time PCR analysis of the level of NMT1 transcripts in wild-type or F11 plants grown in the presence or absence of ethanol (EtOH). This analysis was based on leaf mRNA. The standard deviation on each of the measurements was 4, 4, and 7% for the wild type, F11-ethanol, and F11+ethanol, respectively.
(B) Top: Immunoblot analysis of the amount of NMT1 in wild-type or F11 plants grown in the presence or absence of ethanol for the indicated time. The analysis was based on proteins from leaves and flowers. Bottom: Ponceau red staining of the corresponding gel sample confirming equal protein loading. The arrowheads indicate the position of the Mr marker (175, 94, 67, 46, and 30 kD). The major band corresponds to the large chain of ribulose-1,5-bisphosphate carboxylase/oxygenase.
(C) Reversal of the phenotype of a given seedling induced by ethanol. F11 seedlings were grown in the absence of ethanol for 2 weeks (yellow circle). NMT1 was induced in the presence of ethanol vapor for 1 week. The new flower shoots appearing as a result of this induction are circled in white.
(D) New phenotypes associated with the lack of NMT1 as discovered in F11 plants grown in the presence or absence of ethanol. Wild-type plants grown in the presence or absence of ethanol had phenotypes similar to that of F11 grown in the presence of ethanol.
(E) PR-1 transcripts are induced in the absence of ethanol in line F11. Top: RT-PCR analysis of PR-1 (PR) and EF-1 (EF) transcripts. A mixture of 10 distinct plants was used and only technical replicates performed in this case. Bottom: Phenotype of the corresponding flowers in plants with necrotic leaves.

