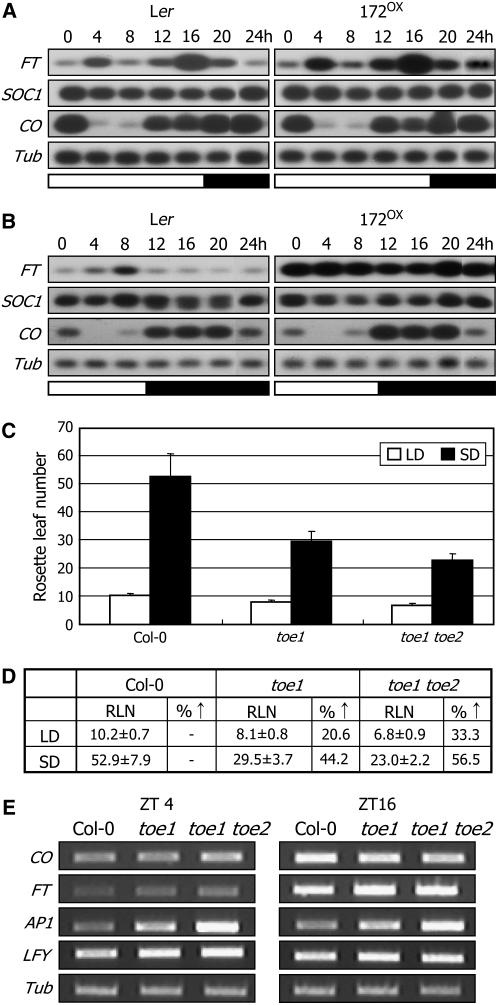
Figure 6.
FT Expression in 172OX Plants Grown under Either LDs or SDs, and Flowering Phenotypes of toe1 and toe1 toe2 under Different Daylengths.
Two-week-old plants grown under LDs were further grown for 5 d under either LDs or SDs before harvesting plant materials. Transcript levels were measured by RT-PCR–based DNA gel blot hybridization.
(A) and (B) FT transcript levels in 172OX plants grown either under LDs (A) or under SDs (B).
(C) and (D) Flowering phenotypes of toe1 and toe1 toe2 under SDs. RLNs were counted at flowering. Thirty plants were measured and averaged for each plant group. Error bars denote se. Statistical significance was determined using Student's t test (P < 0.01).
(E) Expression of CO and FT in toe1 and toe1 toe2. Transcription levels were examined by RT-PCR.

