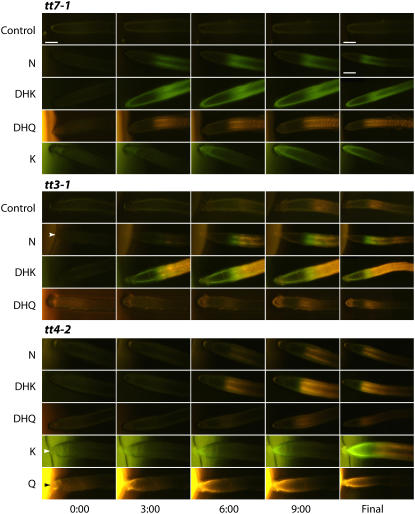
Figure 3.
Adding aglycones to root tips of the tt mutants tt3, tt7, and tt4 resulted in flavonoid movement away from the application site. The time in minutes after aglycone application is indicated. The final column shows the extent of flavonoid fluorescence at the end of the timed sequence. DPBA was added to the agar cylinders to allow visualization of the subsequent flavonoid fluorescence. The controls are DPBA/DMSO agar cylinders. For K and Q generated images, the brighter green and gold fluorescence of DPBA in the agar is evident, at the left of the images, whereas DMSO, N, DHK, and DHQ exhibit little detectable fluorescence in combination with DPBA. All sequences proceeded for 10 min, except the tt4-K final image is after 25 min. The arrowheads indicate the instances where the root tip is in contact with the agar cylinder. Scale bars = 100 μm. The final images are generally smaller as they are montages of several images to show more of the root. The smaller scale bar corresponds to these images.

