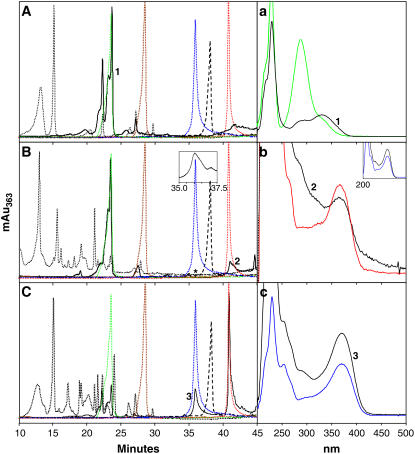
Figure 5.
The addition of N to tt4-1 root tips produced flavonoid compounds in aerial tissue after 24 h. Representative HPLC chromatograms are from crude extracts (dotted black lines) and hydrolyzed crude extracts (solid black lines) from tt4-1 negative controls (A); tt4-1 aerial tissue extracts after 100 μm N was applied at root tips for 24 h (B); and wild-type aerial tissue (C). The standards and their retention times are indicated by the overlaid colored peaks in A to C (brown: DHK, 29.7 min; green: DHQ, 23.4 min; blue: Q, 35.8 min; black dashes: N, 38.4 min; red: K, 40.8 min). a to c show the absorption spectra of the numbered peaks confirming their identity. The black curve is from the crude extract and the colored line is the standard with the same color scheme as above. The absorption quantities on the y axes have been removed for clarity. Generally, hydrolysis reduced the absorption by an order of magnitude. Extracts from root tissue after the application of N to the cotyledons produced similar chromatograms. The inset in B is an enlargement of the hydrolysis chromatogram between 35 and 37.5 min to show the small Q peak located at the asterisk. The inset in b shows the absorption profile for the same peak (black line) compared to that of the standard (blue line).

