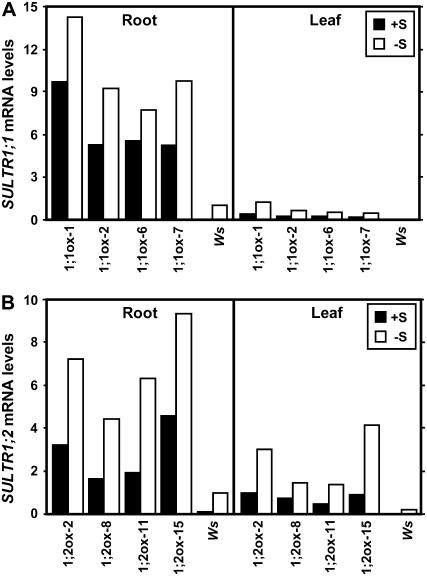
Figure 4.
Accumulation of SULTR1;1 and SULTR1;2 transcripts by long-term sulfur limitation. A, SULTR1;1 mRNA levels in 35S:SULTR1;1mycHis lines (1;1ox-1, 1;1ox-2, 1;1ox-6, and 1;1ox-7) and Ws wild-type plants. B, SULTR1;2 mRNA levels in 35S:SULTR1;2mycHis lines (1;2ox-2, 1;2ox-8, 1;2ox-11, and 1;2ox-15) and Ws wild-type plants. Plants were continuously grown for 15 d on agar medium containing 1,500 μm sulfate (+S; black bars) or 5 μm sulfate (−S; white bars). The mRNA levels were determined by quantitative real-time RT-PCR using gene-specific primers for SULTR1;1 (A) and SULTR1;2 (B), and normalized using UBQ2 as described in the “Materials and Methods.” The mRNA levels are indicated as relative values calculated by comparison with the value of −S (5 μm sulfate) Ws root sample as 1.

