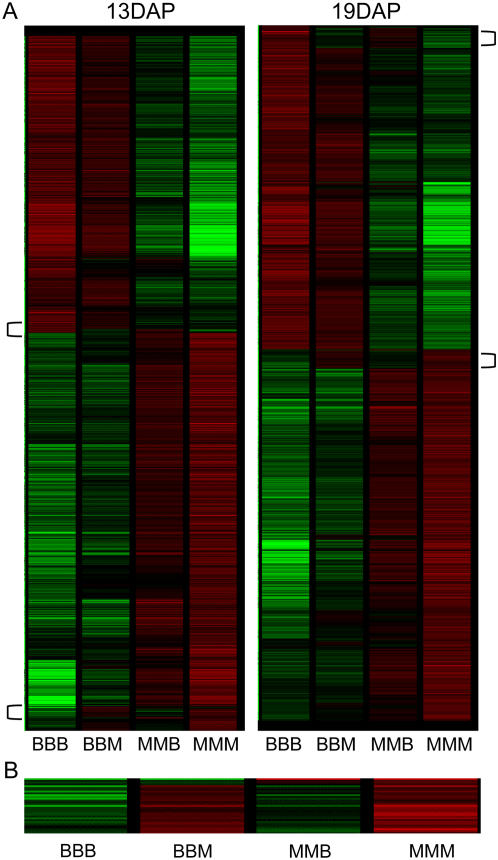
Figure 1.
Gene expression and sources of variation among endosperm genotypes. A, Hierarchical clustering of the genes that are differentially expressed among genotypes in 13- and 19-DAP endosperm. Green indicates low relative expression, whereas red indicates high relative expression and black indicates no difference relative to the profile average. A subset of exceptional genes with hybrid expression profiles similar to the male parent are indicated by brackets. B, The bottom bracketed region from the 19-DAP clustering is enlarged to show that the hybrid expression level is more similar to the male parent than to the female parent.

