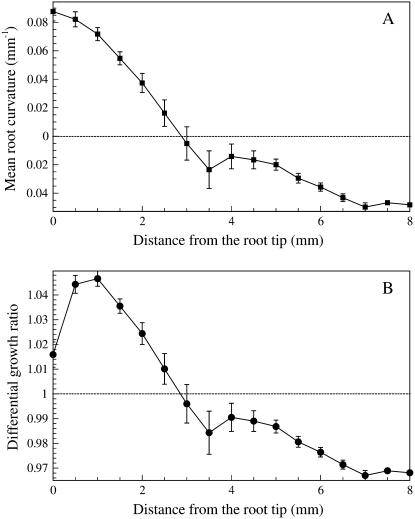
Figure 12.
A and B, Mean root curvature (A) and differential growth ratio (B) between the upper and lower sides of the root plotted as a function of distance from the root tip. Positive curvature and differential growth ratio greater than 1 indicate downward bending and vice versa. The vertical bars indicate se.

