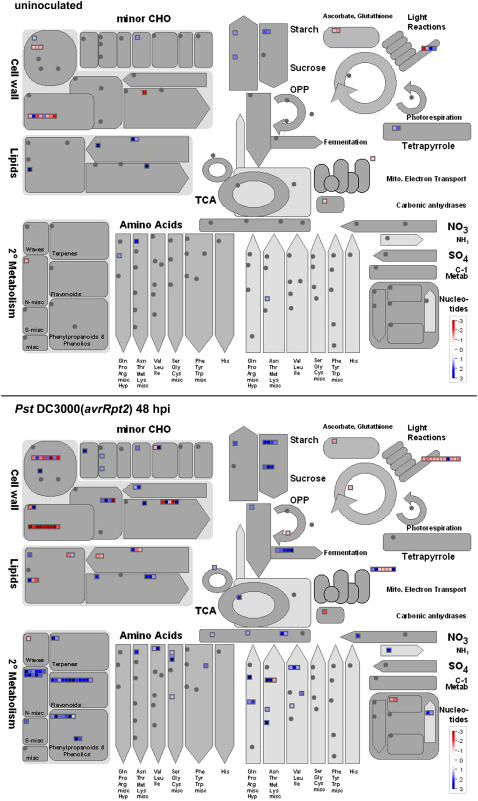
Figure 8.
Metabolism changes in gh3.5-1D plants. MAPMAN was used to observe metabolic changes in gh3.5-1D plants either uninoculated or inoculated with Pst DC3000(avrRpt2) at 48 hpi. The average fold change of the three biological replicates is presented as illustrated in the fold change colors in the bottom right of each image (red, repressed; blue, induced).

