Figure 3.
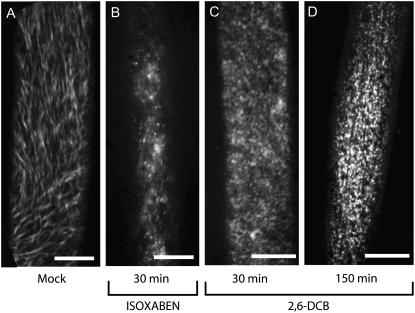
Live-cell imaging of YFP∷CESA6 in cells treated with mock (A), isoxaben (B), or DCB (C and D). Images represent time-averaged projections of 61 frames spaced 5 s apart. Movement of mock-treated YFP∷CESA6 gives rise to strands of YFP emission (A), whereas isoxaben clears the YFP∷CESA6 label from the plasma membrane focal plane after 30 min (B). In contrast, DCB causes CESA to accumulate at the plasma membrane after 30 min of treatment (C). Complexes are nonmotile and, therefore, are seen as punctae in the time-averaged image (C). After 150 min of DCB treatment (D), YFP∷CESA6 punctae appear brighter at the plasma membrane when compared with C. Scale bars = 10 μm.

