
Figure 1.
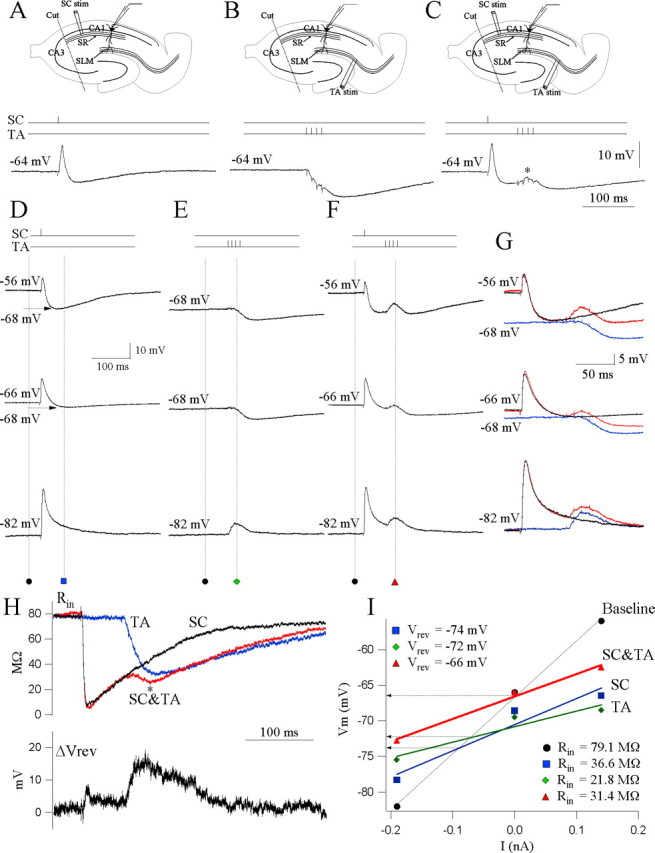
CA1 circuit integration of afferent inputs. A, Schaffer (SC) pathway stimulation. An example of a current-clamp somatic response to a single stimulus applied in stratum radiatum. The resting potential of the cell is -64 mV. The schematic shows the recording setup: one stimulating electrode is used to stimulate the Schaffer collaterals (SC). Somatic patch recording from CA1 pyramidal neurons records responses elicited by Schaffer stimulation. B, Temporoammonic (TA) pathway stimulation. Current-clamp response of the same cell to a burst of four stimuli at 100 Hz applied in stratum lacunosum moleculare. Note the inhibitory somatic response. Recording setup, One stimulating electrode is used to stimulate the temporoammonic axons (TA). Somatic patch recording from CA1 pyramidal neurons records responses elicited by temporoammonic stimulation. C, Schaffer-temporoammonic (SC&TA) pathway stimulation. Current-clamp response of the same cell to paired Schaffer and temporoammonic stimulation such that a single Schaffer stimulus precedes the temporoammonic burst stimulus by 60 ms. Note the integrated response recorded at the soma (asterisk). Similar results are obtained from 12 cells. Recording setup, Two stimulating electrodes are used, one to stimulate the Schaffer collaterals and the other to stimulate the temporoammonic axons (TA). Somatic patch recording from CA1 pyramidal neurons records responses elicited by the Schaffer-temporoammonic stimulation. D, Vm at rest (-68 mV) was displaced to depolarized (-56 mV, 0.14 nA) and hyperpolarized (-84 mV, -0.19 nA) levels by current injection. Recordings are from a different cell than that depicted in A-C. E, Responses to temporoammonic (TA) pathway stimulation at the three levels of Vm in the same cell as D. F, Integrated output of the soma to Schaffer-temporoammonic stimulation measured at three levels of Vm. G, Superimposed traces from D-F. Black, SC; blue, TA; red, SC&TA. H, Top, Calculated plots of the time continuous input resistance (Rin) throughout the synaptic response for the three stimulus conditions. Black, SC; blue, TA; red, SC&TA. Bottom, Calculated plot of the subtracted continuous Vrev. Note the depolarizing shift in Vrev during the Schaffer-gated temporoammonic response. I, I-V plot of the synaptic responses to Schaffer, temporoammonic, and Schaffer-temporoammonic stimulations. Measurements were made at baseline (square) and at the time point corresponding to the peak of the gating effect. Lines are the best linear fit to each set of points, and Rin (values indicated) is the slope of the line. Intersection of the lines with the baseline indicate the apparent reversal potential of the particular response.