
Figure 3.
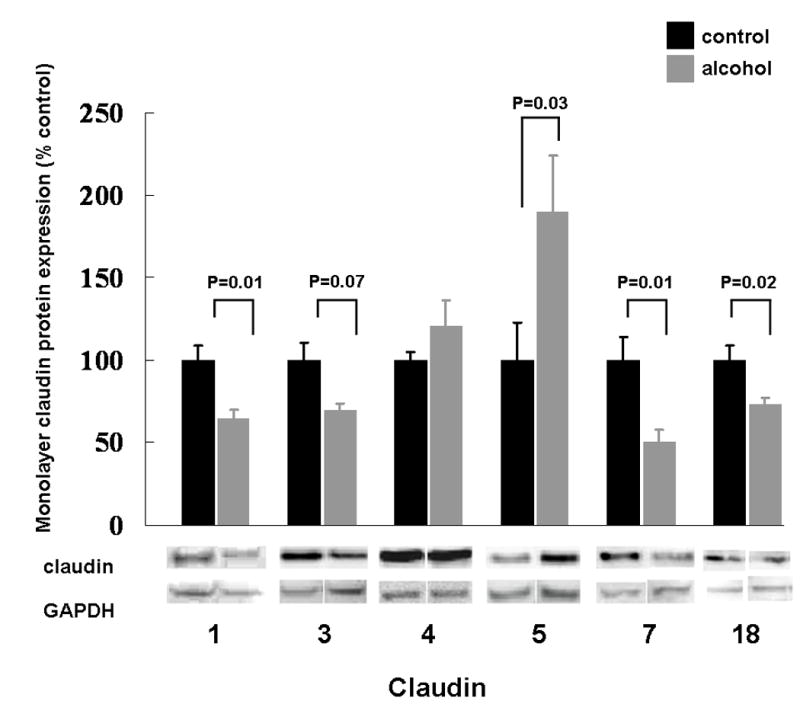
The relative protein expression, as determined by western immunoblot analysis, of claudin-1, -3, -4, -5, -7, and -18 in alveolar epithelial monolayers (7 days in culture) derived from type II pneumocytes isolated from rats fed either the Lieber-DeCarli liquid diet with 36% of the total calories as maltin-dextrin (control) or an isocaloric Lieber-DeCarli liquid diet with 36% of the total calories as ethanol (alcohol). The alveolar epithelial monolayers include cells that have predominantly a type II phenotype and cells that have predominantly a type I phenotype. For each specific claudin the relative amount of protein was quantified by determining the densitometry of the bands on the western immunoblots, and then normalized to the densitometry of the GAPDH band from the same sample. Each claudin in the alcohol-fed group was then expressed as a percentage of change compared to the lung tissue from control-fed rats. Each value represents the mean ± SEM of at least six rats, and the P values that were < 0.10 for comparisons between the control-fed and alcohol-fed rats are shown. Representative immunoreactive bands for the respective claudins are shown below the summary data.