
Figure 4.
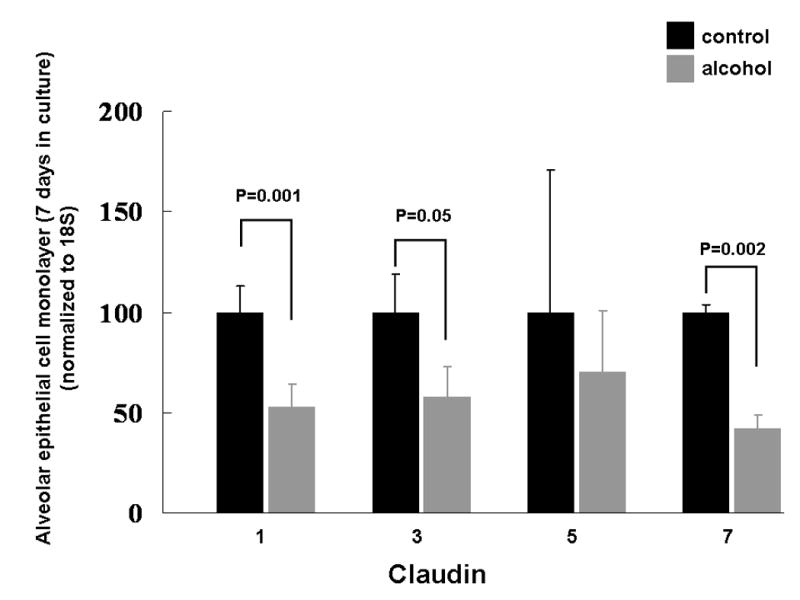
The relative gene expression of claudin-1, -3, -5, and -7, as determined by real-time PCR (see text for details), in alveolar epithelial monolayers (7 days in culture) derived from type II pneumocytes isolated from rats fed either the Lieber-DeCarli liquid diet with 36% of the total calories as maltin-dextrin (control) or an isocaloric Lieber-DeCarli liquid diet with 36% of the total calories as ethanol (alcohol). The alveolar epithelial monolayers include cells that have predominantly a type II phenotype and cells that have predominantly a type I phenotype. mRNA expression for each of the claudins was normalized to 18S and then expressed relative change to control monolayers. Each value represents the mean ± SEM of at least six rats, and the P values that were < 0.10 for comparisons between the control-fed and alcohol-fed rats are shown.