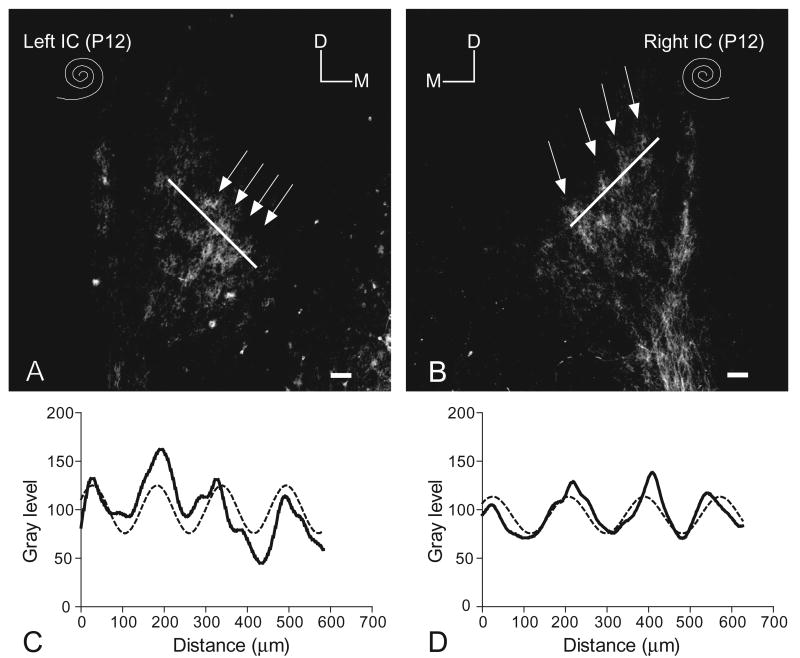
Fig. 2.
(A, B) Paired images illustrating symmetrical DiI labeling of the banded pattern (arrows) of crossed DNLL fibers in the central nucleus of the IC on each side in a 12-day-old (P12), sham-operated (intact condition of cochleas indicated by spiral symbols) control rat pup. For orientation, dorsal (D) and medial (M) are indicated in each image. Scale bars=100 μm. (C, D) Line plots of DiI labeling sampled along a line across axon layers in the IC (see corresponding lines in A and B, respectively) demonstrating periodic changes in gray level (solid lines in graphs) corresponding to the bands of label in A and B, respectively. A sine function that best fit the gray level profile is shown (hatched line).

