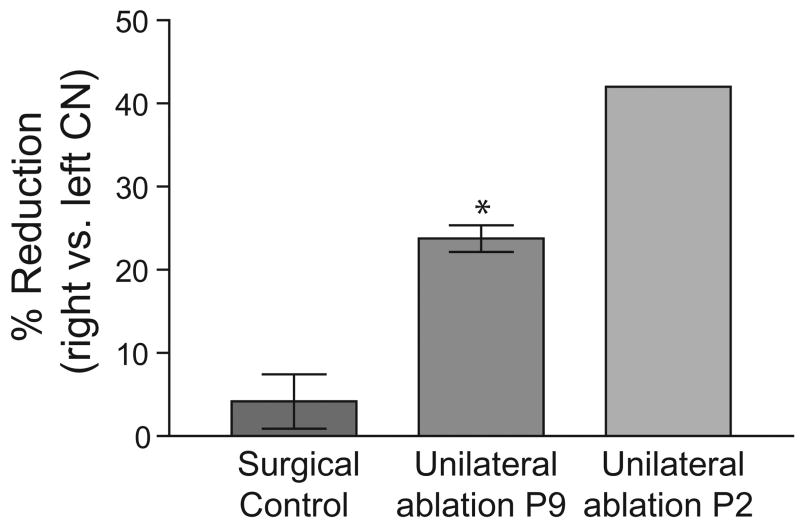
Fig. 6.
Bar graph illustrating the mean percent difference in volume of the CN on each side for the control group (left bar) and a P9 cochlear ablation group (center bar). For comparison, data from the P2 ablation group in Gabriele et al., 2000b are shown in the right bar. Note that the 25% reduction in CN volume on the side of the cochlear ablation is significantly different than variation in the control group (* P<0.05 t-test). However, the reduction is considerably less than for the P9 ablated group (about 50% reduction). All ablations are considered right ablations. Whiskers indicate standard error of the mean for present data, n=8.

