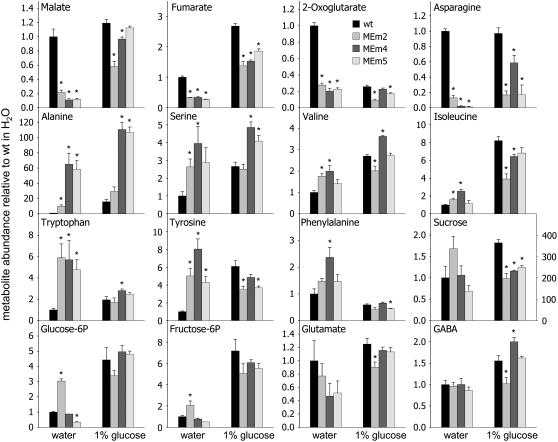
Figure 6.
Metabolic changes assayed by GC-MS in MEm transformants and the wild type during the complementation assays. Values presented are means ± se of two replicates of pools of at least 20 plantlets each. An asterisk (*) indicates significant differences to corresponding wild-type values calculated by Student's t test (P < 0.05). In the Suc panel, the scale at the right refers to data obtained after Glc feeding.

