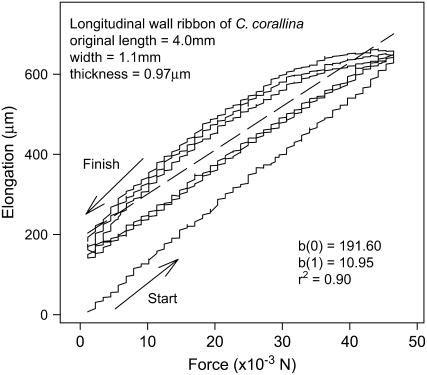
Figure 1.
Loading and unloading paths of a typical stretching experiment conducted on a wall ribbon obtained from a cell number 2. The r2 and the slopes of the linear regression (dashed line), b(1), were calculated from data points in the loading and unloading cycles. Each loading and unloading cycle lasted about 10 min.

