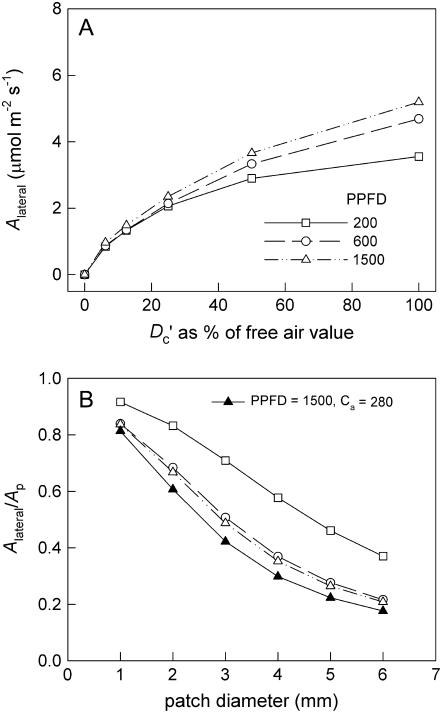
Figure 9.
A, Change of modeled Alateral with different reductions in the effective Dc′ inside the leaves compared to the free air value. B, Change of modeled relative Alateral/Ap for petunia with patch diameter assuming Dc′ = 20%. Modeled using parameters of A/Ci response curves measured in petunia at the three PPFD shown, in ambient CO2 concentration of 360 μmol mol−1, except for the curve shown in B with black symbols, where a preindustrial CO2 of 280 μmol mol−1, a 25% increase in conductance, and a 15% reduced leaf thickness was used.

