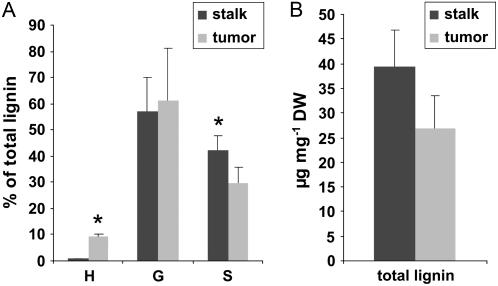
Figure 5.
Identification of aromatic suberin compounds in tumors. A, Ratios of H, G, and S to the total amount of lignin monomers released from inflorescence stalk (dark bars) or tumor tissue (light bars). B, Sum of lignin monomers given in micrograms lignin per milligram dry weight (DW). Bars represent mean values (±sd) of three independent experiments. Asterisks denote statistically significant differences (*: P < 0.05) between inflorescence stalk and tumor values (Student's t test).

