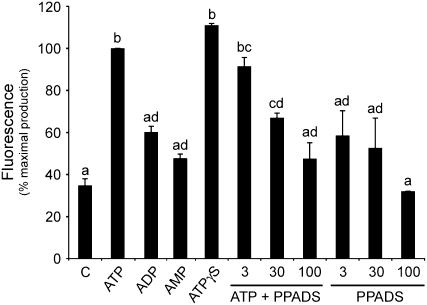
Figure 3.
ATP mediates NO production via P2-like receptors. Shown are NO levels in cells treated with 1 mm ATP, ADP, AMP, or ATP-γ-S. Doses effects of the P2 antagonist PPADS (μm) on 1 mm ATP-induced NO production were measured. NO levels were measured as in Figure1B and expressed as a percentage (100% corresponding to the gradient of NO production of ATP-treated cells in the absence of inhibitors). Error bars represent se of means (n = 3). Means denoted with the same letter do not significantly differ at P < 0.005 according to one-way ANOVA.

