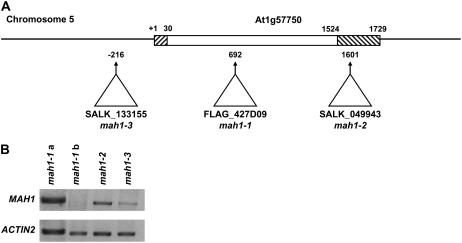
Figure 2.
Structure of the MAH1 gene and transcript levels in mah1 mutant lines. A, Genomic organization of MAH1 and location of T-DNA insertions in the mutant lines investigated here. The MAH1 coding sequence is represented by a white box (there are no introns in At1g57750), the 3′-UTR sequence is indicated by diagonal hatching down and to the right, and the 5′-UTR sequence is indicated by diagonal hatching down and to the left. Arrows and numbers above them indicate the positions of the T-DNA insertions (triangles). B, Analysis of MAH1 transcript levels in mutant stems. MAH1 expression was analyzed by RT-PCR using total RNA and ACTIN2 as a control. Two different sets of primers were employed to screen mah1-1 to check for transcriptional knockout: Gene-specific results depicted in mah1-1a correspond to a unique set of primers ranging from the start site of the gene to approximately 60 bp upstream of the T-DNA insertion; mah1-1b results correspond to a set of primers spanning from 34 to 468 bp downstream of the insertion.

