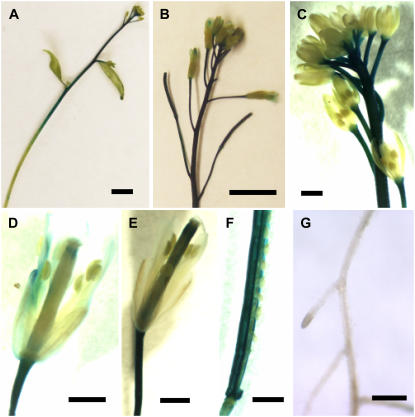
Figure 5.
Organ expression patterns of MAH1 detected in transgenic MAH1:GUS lines. Various organs of transgenic plants transformed with GUS reporter constructs expressed under control of the native promoter of MAH1 are shown. Differential staining for GUS activity (blue) is indicative for organ-specific gene activity of MAH1. A to C, Top portions of inflorescence stems. D, Young flower. E, Mature flower. F, Mature silique. G, Root and root caps. Bars: A and B = 5 mm; C to F = 1 mm; G = 0.25 mm.

