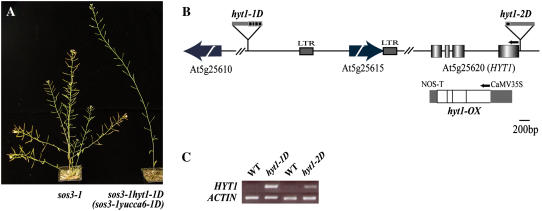
Figure 1.
Identification of the T-DNA insertion sites and transcript level changes in sos3-1 hyt1-1D (sos3-1 yucca6-1D) and sos3-1 hyt1-2D (sos3-1 yucca6-2D). A, Morphological phenotypes of sos3-1 hyt1-1D. sos3-1, wild-type plant (left), and sos3-1 hyt1-1D (sos3-1 yucca6-1D; right) grown on soil for 8 weeks are shown. B, Gene organization of HYT1 (YUCCA6) and schematic representation of T-DNA insertion alleles are illustrated. Arrow boxes indicate predicted genes near T-DNA insertion position. Boxes represent exons, and the intervening lines denote introns. The location of T-DNA insertion in alleles of hyt1-1D (yucca6-1D) and hyt1-2D (yucca6-2D) are shown as boxes above the genomic structures. The arrows above the genomic structure denote the direction of translation. Overexpression construct for ORF is shown below the genomic region of HYT1. NOS, Nopaline synthase. C, HYT1 (YUCCA6) expression levels in hyt1-1D (yucca6-1D) and hyt1-2D (yucca6-2D) compared with the wild type were shown in RT-PCR analysis. Total RNA was extracted from 4-week-old mature rosette leaves of wild type and mutants. ACTIN was used as a control for loading.

