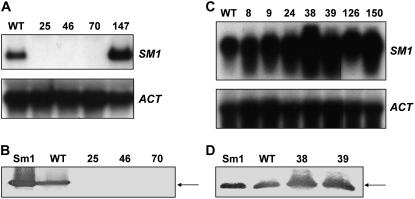
Figure 3.
SM1 expression in transformants. A and C, Northern analysis of transformants. Total RNA was extracted from wild type (WT), deletion strains (SKO25, SKO46, SKO70), and strain with ectopic integration of the construct (147) cultured in VMS media for 5 d (A), and overexpression strains (OE8, OE9, OE24, OE38, OE39, OE126, and OE150) cultured in GYEC medium for 3 d (C). Fifteen micrograms in A and 10 μg in C of total RNA were separated on formaldehyde-agarose gel, transferred to a Hydrobond-N+ nylon membrane, and hybridized with the 264-bp PCR product of the SM1 gene (A and C, top). The same membrane was hybridized with a 550-bp actin fragment PCR amplified from T. virens wild-type cDNA as a control for even loading (A and C, bottom). B and D, Western analysis of transformants. Immunoblot of the protein profile of 5-d VMS CFs from T. virens wild-type and deletion strains (B) and 3-d CFs of overexpression and wild-type strains cultured in GYEC medium (D). Pure Sm1 was included as positive control (Sm1). Six micrograms of total protein of each strain was loaded per lane. The 12.6-kD Sm1 is indicated by arrows.

