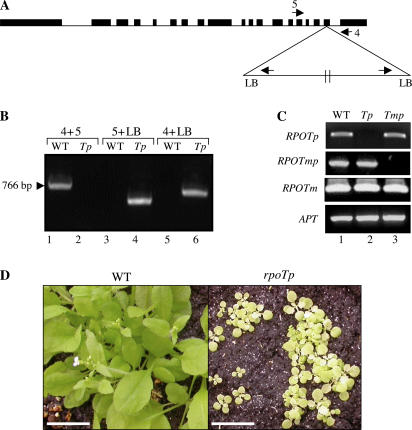
Figure 2.
Selection and characterization of a homozygous line for rpoTp. A, Schematic presentation of the T-DNA insertions and the location of the primers that have been used for PCR analyses. B, Characterization of a homozygous line after the third backcross. The absence of wild-type DNA was verified by PCR using primers 4 and 5 (lanes 1 and 2) and the presence and orientation of the T-DNA insertion was analyzed by PCR using primers LB and 5 (lines 3 and 4) or primers LB and 4 (lines 5 and 6). C, The absence of RPOTp (line 2) or RPOTmp (line 3) transcripts in the two T-DNA insertion mutants has been verified by RT-PCR. Transcripts for RPOTm and APT have been analyzed as controls. D, Wild-type and homozygous RPOTp T-DNA insertion mutants grown in soil under a 16-h-light/8-h-dark cycle for 3 weeks. Scale bar = 1 cm. [See online article for color version of this figure.]

