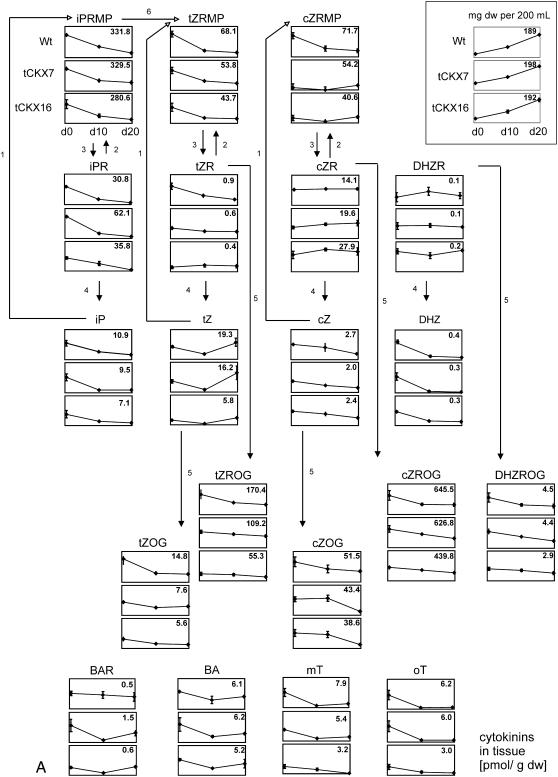
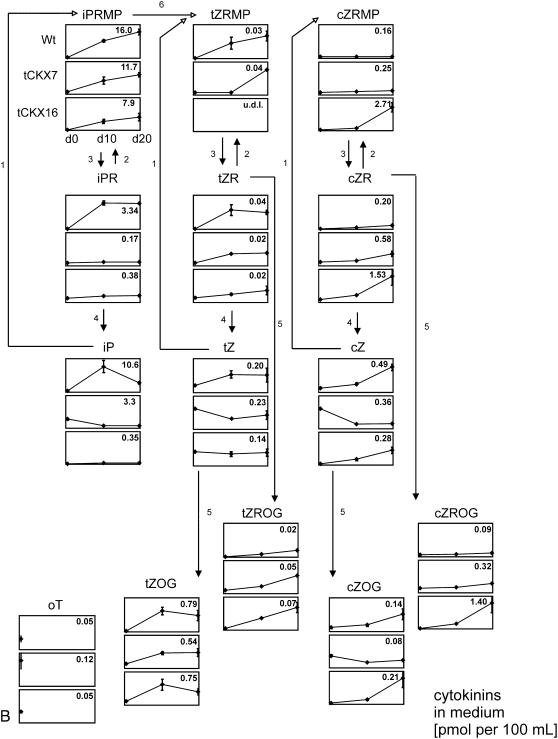
Figure 3.
A, Concentrations of endogenously produced cytokinins in tissues of wild-type P. patens and CKX-overexpressing mutants (tCKX7 and tCKX16) at three time points (days 0, 10, and 20) as determined by UPLC-MS/MS. Three independent liquid cultures of each type were harvested and analyzed. Results are presented as mean values with sds. The y scale of the graph for each compound is identical, and in each graph the maximum cytokinin concentration is given in pmoles per gram DW at the top right. Growth curves are presented at the top (milligrams of tissue DW per 200 mL). Data are available as Supplemental Table S1. For abbreviations of cytokinins, see Supplemental List S1. 1, Adenine phosphoribosyltransferase; 2, adenosine kinase; 3, phosphatase/nucleotidase; 4, adenosine nucleosidase; 5, Z-O-glycosyltransferase; 6, cytochrome P450 monooxygenases. The postulated metabolic pathways (Schematic) are based on those presented by Sakakibara (2006). B, Concentrations of endogenously produced cytokinins in culture medium (pmoles per 100 mL) of wild-type P. patens and CKX-overexpressing mutants (tCKX7 and tCKX16) at three time points (days 0, 10, and 20). Some compounds that were found in the tissue extracts were not detectable in the culture medium (for further details, see A). Data are available as Supplemental Table S2. u.d.l., Under detection limit.


