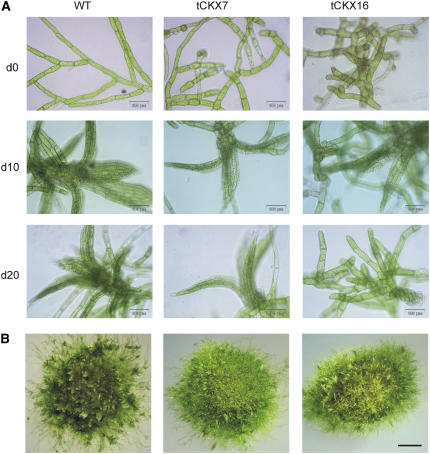
Figure 4.
A, Micrograph of protonema and developing gametophores in liquid cultures of wild-type P. patens and the transformants tCKX7 and tCKX16. Pictures were taken on days 0, 10, and 20 (d0, d10, and d20) and correspond to cultures from which the data displayed in Figure 3, A and B, were obtained; bars represent 100 μm. B, Morphology of cultures grown on agar after 8 weeks; bar represents 1 mm.

