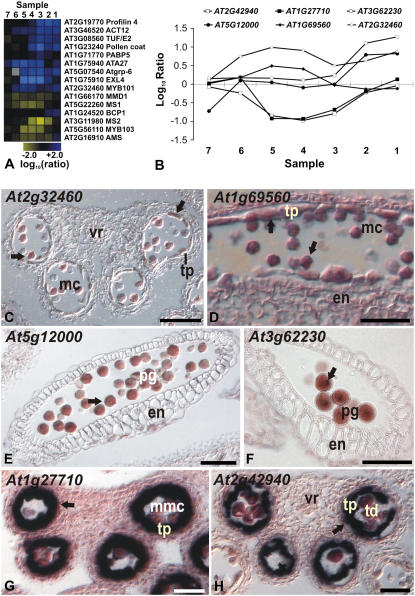
Figure 4.
Microarray data and results of in situ hybridizations for selected genes whose expression is affected in ms1 mutant flowers. A, Stage-specific effects of MS1 on the expression of selected genes with previously characterized expression patterns. The diagram was generated as outlined for Figure 3. B, Log10-transformed expression ratios from the analysis of individual tissue samples (as indicated) are shown for the genes described below. C to H, Result of in situ hybridization experiments for selected genes. Arrows indicate regions of expression. C and D, MYB101 (At2g32460) and MYB105 (At1g69560) are expressed in pollen grains and in the tapetum. Transverse (C) and longitudinal (D) sections through anthers of stages 11 and 9, respectively, are shown. E, At5g12000, encoding a protein kinase, is expressed exclusively in mature pollen grains. A longitudinal section through a stage 12 anther is shown. F, Expression of At3g62230, encoding an F-box protein, was observed in germinative cells of mature pollen grains. A longitudinal section through a stage 12 anther is shown. G, The expression of At1g27710, which encodes a Gly-rich protein, is exclusively observed in tapetal cells. H, Expression of At2g42940, which encodes an AT-hook DNA-binding protein, was found in the tapetum after the completion of meiosis. Note that this gene has a very narrow window of expression during tapetum development similar to that of At1g27710. G and H, Transverse sections through anthers of stage 8 and 7, respectively. en, Endothecium; mc, microspore; mmc, microspore mother cell; pg, pollen grain; td, tetrads; tp, tapetum; vr, vascular region. Scale bars = 50 μm (C and E) and 25 μm (D, F, and G).

