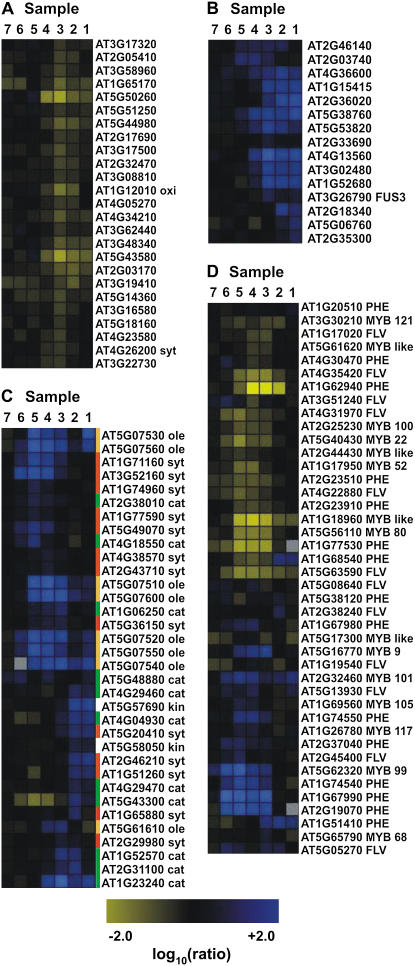
Figure 5.
Expression of selected functionally related genes throughout anther development as derived from the ms1 experiments. Grouping of the genes was done with Rosetta Resolver using an agglomerative hierarchical clustering algorithm and Pearson correlation as a proximity measure. Genes that are down-regulated in the mutant compared to the wild type are depicted in blue and up-regulated genes in yellow. The intensities of the colors increase with increasing expression differences, as indicated at the bottom. A, Genes involved in protein degradation or ethylene biosynthesis. B, LEA genes and genes involved in GA response. C, Genes involved in lipid metabolism or storage. Three distinct sets of genes involved in different aspects of lipid metabolism are shown. Genes involved in lipid synthesis (red bars) are predominantly repressed in samples 6, 5, and 4; oleosin-like genes (orange bars), which are required for lipid storage, are repressed in samples 5, 4, and 3; and most of the genes that mediate lipid catabolism (green bar) are down-regulated in samples 3, 2, and 1. D, Genes encoding MYB transcription factors and genes involved in phenylpropanoid metabolism. cat, Catabolism; des, desaturase; FLV, genes involved in flavonoid synthesis; kin, kinase; ole, oleosin; PHE, genes involved in the synthesis of phenolic compounds; syt, synthesis. Annotation of MYB or MYB-like genes is based on Larkin et al. (2003).

