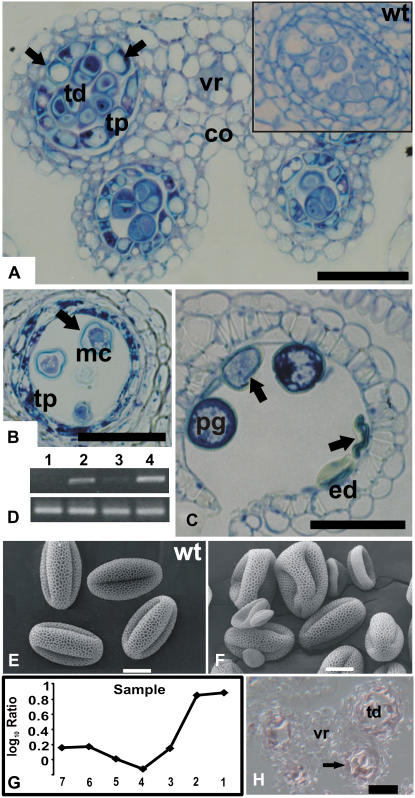
Figure 6.
Characterization of a T-DNA insertion line for gene At2g40850. A to C, Transverse sections through mutant anthers. The sections were stained with toluidine blue and then photographed using bright-field microscopy. A, Section through a stage 6 mutant anther. Inset shows a section through a locule from a wild-type plant at the same developmental stage. Note the abnormally enlarged vacuoles of tapetal cells in the mutant (arrows). Representative images are shown of multiple sections of mutant and wild-type anthers that were analyzed. B and C, Sections through mutant anthers at stage 11 (B) and at stage 12 (C) after breakage of the septum. Note the collapsed pollen grains (marked by arrows). D, Effect of the T-DNA insertion on At2g40850 expression. Top, Gene-specific primers for At2g40850 were used for RT-PCR; bottom, primers for actin were used as a control to verify that roughly the same amount of cDNA was used in the different reactions. RNA was isolated from the following tissues: whole inflorescences of plants mutant for At2g40850 (lane 1); flower buds of wild-type plants that were smaller (lane 2) or larger (lane 3) than 0.5 mm; whole inflorescences of wild-type plants (lane 4). E and F, Scanning electron micrographs of pollen grains from wild-type plants (E) and from the mutant line for At2g40850 (F). Microarray data for At2g40850. G, Log10-transformed ratios from the analysis of temporal gene expression in ms1 mutant flowers are shown. At2g40850 showed two distinct peaks of expression, one at an early stage of stamen development and a second at later stages, when mature pollen grains are formed. H, Result of in situ hybridization for At2g40850. A transverse section through a stage 7 anther is shown. A weak hybridization signal was obtained in tapetum and tetrads (arrow). co, Connective; ed, endothecium; mc, microspore; pg, pollen grain; tp, tapetum; tetrads, td; vr, vascular region. Scale bars = 30 μm (A, B, C, and H) and 10 μm (E and F).

